Springfield

Team Scoring Insights
Chris Wagner stands out as Springfield’s primary finisher, leading the club with 24 goals while also contributing heavily as a playmaker. His position near the top-right of the chart reflects one of the most complete offensive profiles on the roster.
Aleksanteri Kaskimäki also emerged as a major offensive contributor with a strong balance between assists and goal scoring. His 20-goal output paired with high assist totals suggests a player driving offense in multiple ways.
Dillon Dubé provided another highly productive scoring profile, sitting well above the goals-to-assists balance line. His 20 goals on a more moderate assist total indicate a shoot-first offensive role and strong finishing efficiency.
Matt Luff and Juraj Pekarčík added valuable secondary scoring depth. Luff’s combination of assists and 14 goals reflects balanced offensive production, while Pekarčík contributed more as a finisher than a distributor.
Hugh McGing and Matthew Peca were more pass-oriented offensive contributors. Both accumulated strong assist totals relative to goals, helping drive puck movement and offensive setup opportunities.
Dylan Peterson’s placement almost directly on the diagonal line suggests one of the most balanced offensive distributions on the team, contributing nearly equally as a scorer and facilitator.
Several younger forwards, including Otto Stenberg, Zach Dean, Nikita Alexandrov, and Jakub Stancl, displayed more modest scoring totals but contributed depth offense throughout the lineup.
On the blue line, Calle Rosén clearly led Springfield defensemen offensively, producing strong assist totals while also contributing eight goals. His profile reflects an active puck-moving defenseman heavily involved in transition and power-play situations.
Hunter Skinner and Marc-André Gaudet contributed more limited offense from the defensive group, with Gaudet functioning primarily as a setup-oriented blueliner.
Overall, the chart suggests Springfield relied on a relatively balanced offensive structure rather than a single dominant scorer. Multiple forwards produced meaningful offense, with a healthy mix of finishers and playmakers spread throughout the lineup.
Team Dashboard
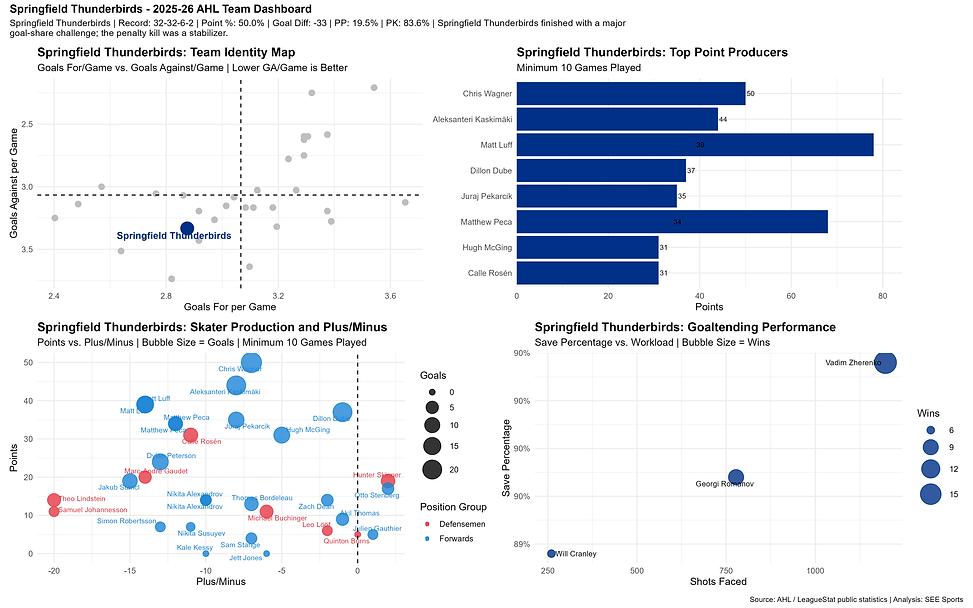
Team Dashboard Insights
• Springfield finished 32-32-6-2 with a 50.0% points percentage and a -33 goal differential, reflecting a team that struggled to consistently control play at even strength.
• The Team Identity Map places the Thunderbirds below league average offensively while also allowing more goals than most contenders.
• Chris Wagner led the club with 50 points, while Aleksanteri Kaskimäki, Matt Luff, Dillon Dubé, and Juraj Pekarčík provided much of the offensive support.
• The Skater Production chart shows many top contributors carrying negative plus/minus ratings, highlighting broader defensive and possession issues across the roster.
• Springfield’s penalty kill was a strength at 83.6%, helping stabilize games despite a modest 19.5% power play.
• Vadim Zherenko handled the primary workload in goal and provided solid overall play behind a team that frequently faced difficult defensive situations.